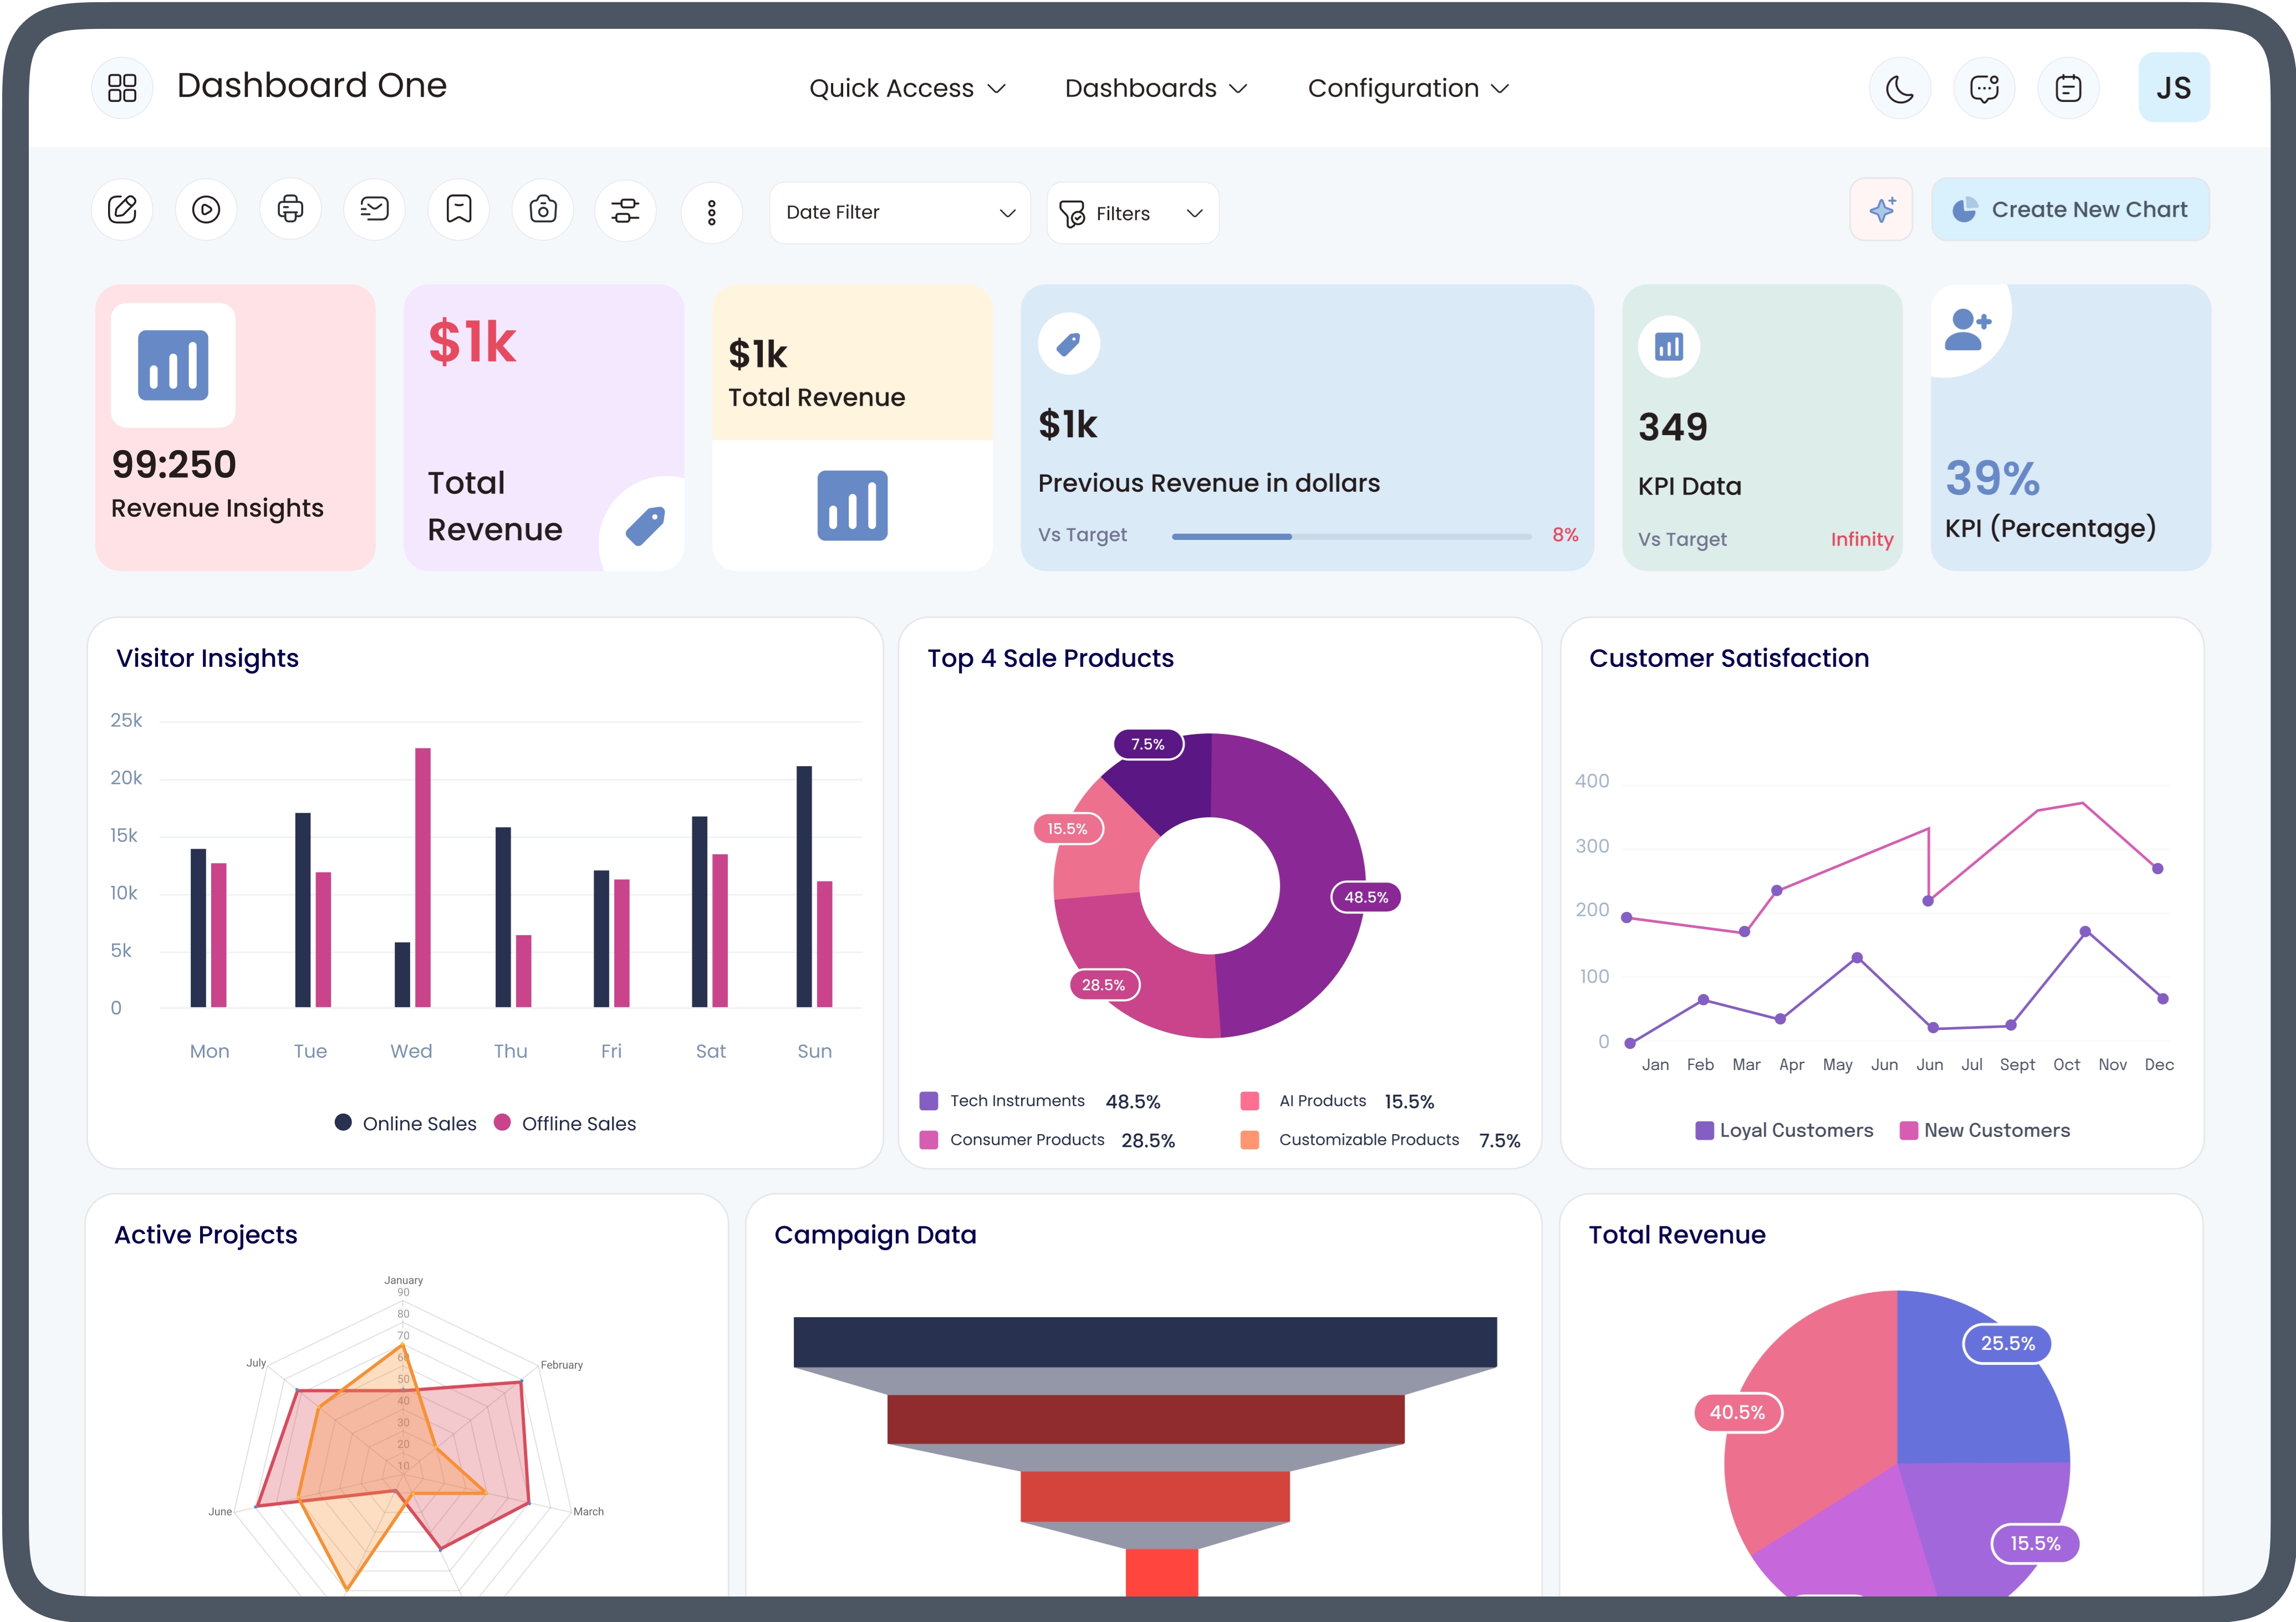
Understanding business data can be difficult when information is spread across sales, accounting, inventory, CRM, and other business applications. Odoo dashboards help bring important information into a visual workspace so users can monitor business activities more efficiently.
For beginners, learning how Odoo dashboards work for beginners starts with understanding how data is collected, displayed, filtered, and converted into useful business insights. An Odoo KPI dashboard takes this a step further by presenting key performance indicators (KPIs) that help users monitor specific business objectives.
This guide explains how Odoo dashboards work, what KPI dashboards do, how beginners can use them, and what to consider when creating an effective dashboard.
What Is an Odoo Dashboard?
An Odoo dashboard is a visual interface that presents business information in an organized format. Instead of opening multiple reports and manually reviewing individual records, users can use dashboard elements to view relevant information from connected Odoo applications.
Depending on the Odoo configuration and installed applications, dashboards may display information related to:
Sales
CRM
Accounting
Inventory
Purchase
Manufacturing
Project management
Human resources
eCommerce
The exact dashboard experience can vary depending on the Odoo version, installed applications, user permissions, and customization.
For beginners, the simplest way to understand an Odoo dashboard is to think of it as a central place for viewing important business information.
How Odoo Dashboards Work for Beginners
Understanding how Odoo dashboards work for beginners becomes easier when the process is divided into a few basic steps.
First, business activities are recorded in Odoo applications. For example, a sales team may create quotations and sales orders, while the accounting team records invoices and payments.
The dashboard then uses available business data and presents selected information through visual elements such as charts, graphs, lists, and KPI cards.
Users can review the displayed information, apply available filters, change reporting periods, and investigate the underlying records when the configuration supports those actions.
In simple terms:
Business data → Odoo applications → Reports/data views → Dashboard → Business insights
This structure allows beginners to move from raw business records toward a more understandable visual overview.
What Is an Odoo KPI Dashboard?
An Odoo KPI dashboard is a dashboard designed around key performance indicators. KPIs are measurable values used to monitor specific aspects of business performance.
For example, a sales dashboard could include indicators related to sales orders, revenue, quotations, or customer activity. An inventory dashboard could focus on stock levels, product movements, or other inventory-related information.
A KPI dashboard is therefore different from a dashboard that simply displays many pieces of information. Its purpose is to focus attention on metrics that are relevant to a particular business objective or role.
Why KPI Dashboards Matter in Odoo
A business can generate a large amount of operational data every day. Reviewing every individual record is rarely practical for managers who need a high-level view.
An Odoo KPI dashboard can organize selected information into a more accessible format. Instead of searching through multiple reports, users can start with important indicators and then investigate specific areas when something requires attention.
For example, a sales manager may want to monitor:
Sales performance
Open quotations
Sales orders
Customer activity
Sales trends
Team performance
The exact KPIs should depend on the organization's objectives rather than simply including every available metric.
Key Components of an Odoo Dashboard
KPI Cards
KPI cards provide a quick view of a specific metric. They are useful when users need to understand an important value without reviewing a complete report.
A KPI card might display information such as total sales, number of open opportunities, or outstanding invoices, depending on the dashboard configuration.
Charts and Graphs
Charts help users understand patterns and trends visually. Depending on the underlying data, users may work with bar charts, line charts, pie charts, or other supported visualizations.
For beginners, charts can make large amounts of information easier to interpret than a long table of records.
Lists and Tables
Lists provide more detailed information than KPI cards. They can help users move from a high-level summary to individual records.
For example, a dashboard may show a summary of sales activity and provide access to the related sales orders.
Filters
Filters allow users to narrow dashboard information according to relevant criteria. Common filtering dimensions can include dates, teams, products, customers, companies, or other available fields.
Filters are particularly important because the same dataset can provide different insights depending on the selected period or business category.
How an Odoo KPI Dashboard Helps Different Teams
Sales Teams
Sales users can use dashboards to monitor sales-related activity and customer opportunities. KPIs can help managers identify areas that require further investigation.
Accounting Teams
Accounting dashboards can provide visibility into financial information and accounting activities. Users can organize relevant financial indicators according to their reporting requirements.
Inventory Teams
Inventory users can monitor stock-related information and product movements through relevant reports and dashboard views.
Project Teams
Project managers can use dashboards to review project-related information, tasks, deadlines, and other operational indicators available within their Odoo environment.
The most useful dashboard depends on the responsibilities of the people using it.
How Beginners Can Read an Odoo KPI Dashboard
Beginners should avoid trying to understand every number at once. A practical approach is to start with the purpose of the dashboard.
Ask three questions:
What am I measuring?
Identify what each KPI actually represents.
What period does the data cover?
A number without a time period can be misleading. Check whether the dashboard is showing today's activity, a monthly period, a quarter, or another date range.
What does the KPI require me to investigate?
A KPI should help users identify an area that may require additional analysis rather than simply becoming another number to monitor.
This approach helps beginners understand dashboards as decision-support tools rather than collections of visual elements.
How to Create an Effective Odoo KPI Dashboard
Creating a useful Odoo KPI dashboard starts with identifying the business questions that users need to answer.
For example, instead of asking, "Which metrics can we display?" a business could ask:
How are current sales performing?
Which opportunities need attention?
What inventory information should managers monitor?
Which financial activities require review?
Which operational areas are changing over time?
Once these questions are defined, relevant KPIs can be selected.
A good dashboard should avoid unnecessary metrics. Too many charts and KPI cards can make the interface difficult to understand and may reduce the value of the information being presented.
Odoo Dashboard Filters and Data Analysis
Filters are an important part of dashboard analysis. They allow users to examine information from different perspectives without necessarily creating a completely separate dashboard for every scenario.
For example, a sales manager could use filters to examine data by:
Date
Salesperson
Sales team
Customer
Product
Company
The available filtering options depend on the underlying Odoo application, report, fields, permissions, and configuration.
For beginners, learning how filters affect dashboard results is an important part of understanding how Odoo dashboards work for beginners.
Odoo Dashboards and Real-Time Business Visibility
One of the practical benefits of connecting dashboards to operational business data is improved visibility into current activities. When users can access updated information from Odoo's business applications, they can spend less time manually collecting information from separate sources.
However, "real-time" should not automatically be interpreted as meaning that every dashboard value changes instantly in every configuration. Data refresh behavior can depend on the Odoo setup, reporting method, integrations, and dashboard implementation.
This is an important consideration when designing dashboards for operational or management use.
Common Mistakes Beginners Should Avoid
Adding Too Many KPIs
More metrics do not automatically create a better dashboard. Too many indicators can make important information harder to identify.
Ignoring the Business Objective
A dashboard should have a clear purpose. Selecting KPIs simply because they are available can produce a dashboard that looks informative but does not answer meaningful business questions.
Using Inconsistent Date Filters
Comparing values from different reporting periods can create confusion. Users should understand the date range behind each KPI.
Failing to Check Data Quality
A dashboard is only as useful as the underlying data. Incorrect, incomplete, or inconsistently entered records can affect the resulting reports and KPIs.
Designing for Everyone
A sales representative, CFO, inventory manager, and project manager may need completely different information. Dashboard design should therefore consider the user's role and responsibilities.
Odoo Dashboard Customization
Businesses may need dashboard views that go beyond standard reporting options. Depending on the Odoo edition, version, installed applications, and technical setup, organizations may use configuration, studio/customization features, reporting tools, or custom development to meet specific requirements.
Customization can include changes to dashboard layouts, metrics, filters, visualizations, or data sources.
However, customization should be driven by business requirements. Building complex dashboards without clearly defined objectives can increase maintenance requirements without necessarily improving decision-making.
Odoo KPI Dashboard Best Practices
For an effective dashboard, consider these best practices:
Define the objective first. Know what the dashboard is designed to monitor.
Select relevant KPIs. Use metrics connected to actual business goals.
Keep the layout simple. Make important information easy to locate.
Use appropriate visualizations. Choose charts that make the underlying data easier to understand.
Provide useful filters. Allow users to analyze information according to relevant dimensions.
Review data quality. Make sure source records are accurate and consistently maintained.
Consider user roles. Different teams require different dashboards.
Review KPIs periodically. Business priorities can change, so dashboards should evolve accordingly.
How Odoo Dashboards Support Better Reporting
Traditional reporting can require users to open different reports and manually interpret information. Dashboards provide a more centralized visual experience by bringing selected information together.
For beginners, this makes dashboards easier to approach because they can start with summarized information and then explore the underlying details when needed.
An Odoo KPI dashboard can also help managers establish a consistent view of selected performance indicators. Rather than relying entirely on manually prepared spreadsheets, users can work from information available within their Odoo environment.
The dashboard itself does not replace analysis. Instead, it provides a structured starting point for understanding business data.
Odoo Dashboards vs. Traditional Manual Reporting
Manual reporting often involves exporting data, organizing spreadsheets, calculating metrics, and preparing visual reports. Odoo dashboards can reduce some of this manual work by presenting information through connected business applications and reporting views.
The difference is particularly useful when organizations need to review information regularly. A dashboard can provide a repeatable reporting interface, while manual spreadsheets may require recurring preparation and data consolidation.
That said, spreadsheets can still be useful for specialized analysis, financial modeling, or situations where users need capabilities outside their Odoo configuration.
Frequently Asked Questions
What are Odoo dashboards used for?
Odoo dashboards are used to organize and visualize business information from Odoo applications. They can help users monitor sales, accounting, inventory, CRM, projects, and other operational activities.
What is an Odoo KPI dashboard?
An Odoo KPI dashboard is a dashboard focused on key performance indicators. It presents selected business metrics so users can monitor specific objectives or areas of performance.
Are Odoo dashboards suitable for beginners?
Yes. Beginners can start with basic dashboards by learning how to read KPI cards, charts, lists, filters, and reporting periods before moving into more advanced customization and analysis.
Can Odoo dashboards be customized?
Customization possibilities depend on the Odoo version, edition, applications, permissions, and technical configuration. Businesses may use available configuration and customization capabilities or development where required.
How many KPIs should an Odoo dashboard have?
There is no universal number. The dashboard should contain enough KPIs to answer its intended business questions without overwhelming users with unnecessary information.
Final Thoughts
Learning how Odoo dashboards work for beginners starts with understanding the relationship between business data, reports, visualizations, filters, and KPIs. Once users understand these fundamentals, they can use dashboards to organize information and explore business performance more effectively.
An Odoo KPI dashboard adds another layer of focus by highlighting metrics that matter to a specific business objective or user role. The most effective approach is to define the reporting purpose first, select meaningful KPIs, maintain reliable source data, and design the dashboard around the people who will actually use it.
For SEO and informational search intent, this topic naturally addresses beginner questions about Odoo dashboards while also covering KPI dashboards, dashboard components, filters, customization, reporting, and practical use cases.