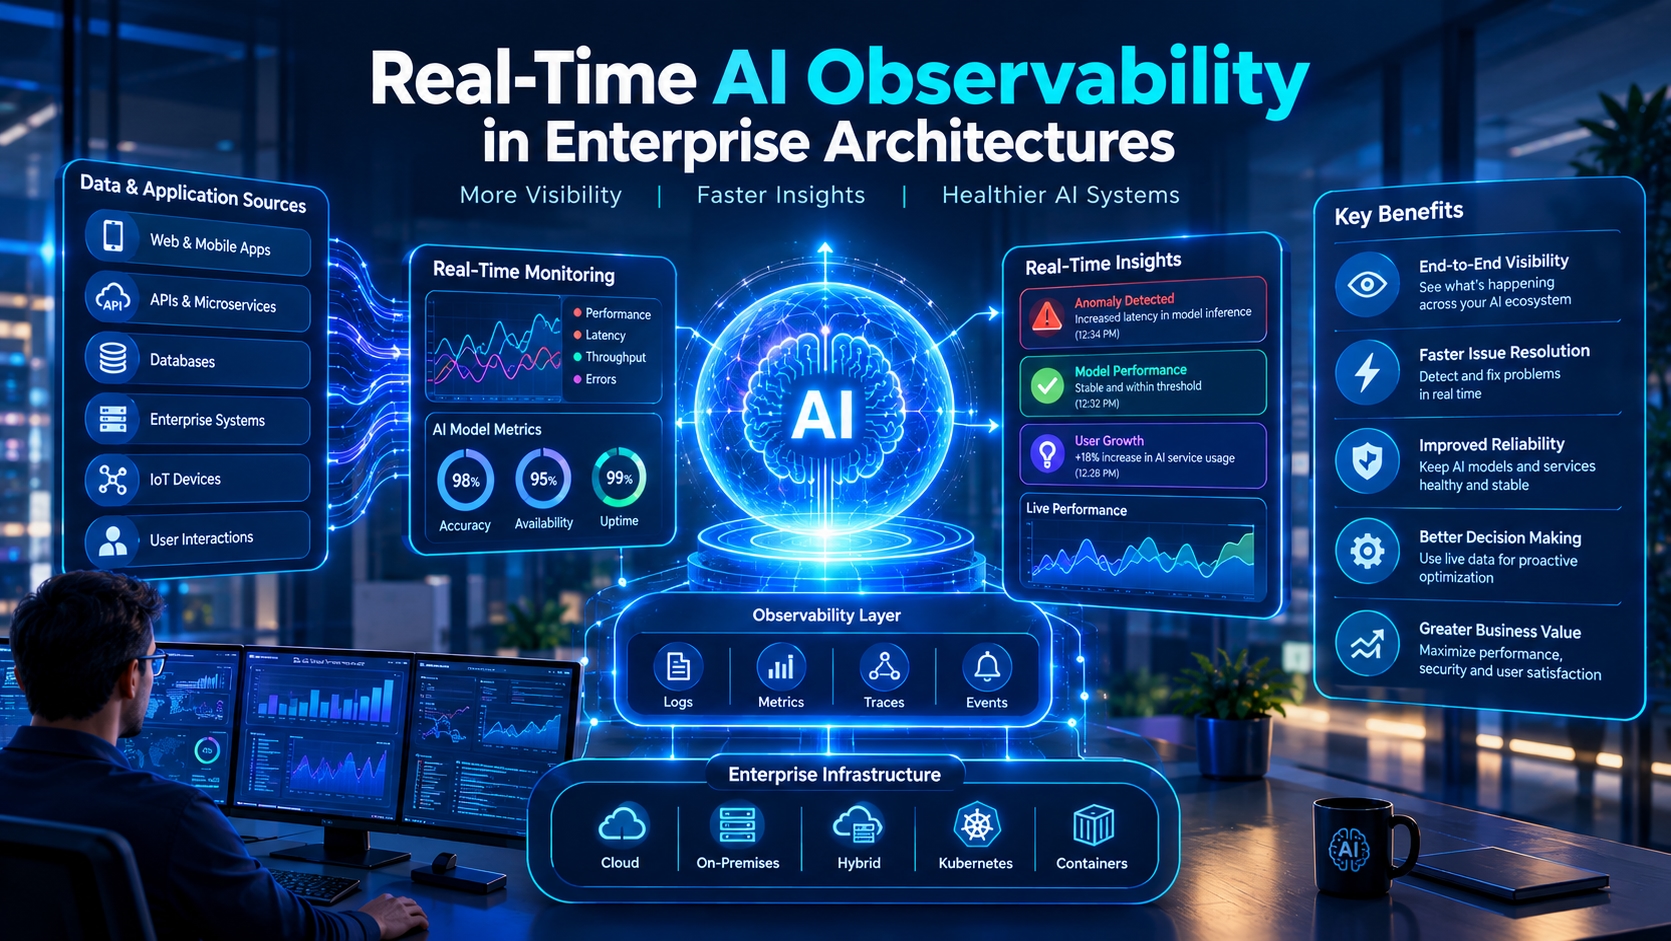
Modern enterprise software systems are undergoing a fundamental transformation as stochastic machine learning models replace traditional deterministic code paths. When logic is hardcoded into functions and microservices, tracing a system error involves inspecting application logs, stack traces, and database transaction records. However, when software relies on large language models, neural networks, and autonomous agents, diagnosing unexpected behavior becomes exponentially more complex. Models do not fail with traditional exit codes or memory access violations. Instead, they fail quietly by drifting in accuracy, outputting subtle hallucinations, or experiencing latency spikes caused by vector retrieval bottlenecks.
Navigating this transition requires engineering teams to re-evaluate their entire monitoring and diagnostic stack. Operating intelligent software at scale demands real-time insights into token usage, prompt variations, latent vector spaces, and downstream execution paths. Companies partnering with a specialized AI Development Company in Sydney often emphasize that deployment is only the initial step in the operational lifecycle. Maintaining reliability, latency SLAs, and decision accuracy over time requires dedicated observability pipelines designed specifically for probabilistic workloads.
Understanding the Anatomy of AI Telemetry
Traditional APM tools track infrastructure metrics such as CPU utilization, memory consumption, network throughput, and HTTP status codes. While these metrics remain essential for infrastructure health, they offer zero visibility into model performance or output fidelity. An API endpoint serving an LLM might respond with an HTTP status 200 OK within 150 milliseconds, yet return a completely hallucinated financial projection to an end user.
To capture meaningful data, modern telemetry architectures must ingest three distinct layers of operational data:
Request and Response Payload Metadata: Capturing raw inputs, system prompts, hyperparameter configurations (such as temperature and top-p values), and generated outputs.
Vector and Context Traces: Logging the exact semantic context retrieved from vector databases during Retrieval-Augmented Generation (RAG) operations, including similarity scores and document chunks.
Model Behavior and Performance Signals: Measuring token throughput speeds, time-to-first-token (TTFT), cost per inference call, and semantic similarity drift.
By structuring telemetry around these three layers, engineering teams establish end-to-end traceability across every inference request. For organizations scaling complex models, leveraging expert AI Development Services provides the architectural groundwork required for enterprise-grade deployments.
Detecting Semantic Drift and Latent Concept Shift
One of the most persistent challenges in production AI deployment is silent degradation. Unlike web servers that crash under heavy traffic, machine learning models experience performance degradation when the underlying statistical distribution of incoming data diverges from their training set. This phenomenon, known as concept drift or data drift, can severely compromise business operations if left undetected.
For example, a predictive credit scoring model trained on historical economic data may perform exceptionally well under stable market conditions. However, during periods of rapid inflation or shifts in consumer spending habits, the model's feature weights no longer reflect current reality. Without real-time drift detection algorithms monitoring feature distributions, financial institutions risk making faulty automated approvals.
Implementing real-time semantic drift monitoring involves calculating statistical distance metrics across streaming input embeddings. When the drift score exceeds predefined thresholds, automated alerts trigger retraining workflows or route high-risk transactions to human review queues. Modern infrastructure strategies frequently leverage a dedicated Server Intelligence Agent to dynamically adjust compute resources and trigger model re-evaluation routines before performance degradation impacts operational workflows.
Tracing RAG Pipelines and Vector Retrieval Performance
Retrieval-Augmented Generation has become the standard architecture for grounding enterprise AI applications in proprietary domain knowledge. By combining vector databases with large language models, organizations reduce hallucinations and ensure responses remain relevant to up-to-date business data. However, RAG pipelines introduce multiple failure points that complicate performance troubleshooting.
When an end-user receives an inaccurate or incomplete response, the root cause could stem from several components within the pipeline:
Query Embedding Misalignment: The user query was converted into a vector representation that failed to align semantically with the target document chunks.
Vector Index Latency or Degradation: The vector database experienced indexing lag, returning stale context or dropping relevant document nodes.
Chunk Re-Ranking Errors: The re-ranking algorithm prioritized irrelevant chunks, crowding out vital context within the LLM's context window.
Context Compression Loss: Summarization algorithms truncated essential details required for precise generation.
To diagnose these issues quickly, observability platforms utilize span-based tracing. Each step in the RAG execution chain, from query transformation and vector similarity search to prompt assembly and LLM response generation, is assigned a unique trace ID. Engineers can inspect individual spans to isolate whether an error originated from document retrieval, vector database latency, or model inference.
Implementing Automated Evaluation and Guardrails
Relying solely on post-hoc analysis is insufficient for high-stakes enterprise applications. Production environments require continuous automated evaluation layers that audit outputs in real time before responses reach end users.
Modern evaluation frameworks deploy specialized evaluator models, often smaller, highly fine-tuned models, to score generated outputs across key dimensions:
Faithfulness: Evaluating whether the output is strictly supported by the retrieved context chunks.
Answer Relevance: Measuring how directly the response addresses the user's initial prompt.
Toxicity and Safety: Verifying that outputs adhere to corporate compliance and content policies.
Data Leakage Checks: Detecting whether sensitive Personally Identifiable Information (PII) or proprietary API keys are accidentally exposed.
When an output fails an evaluation check, real-time guardrails intercept the response. The system can automatically execute a fallback prompt, route the query to a deterministic backup workflow, or request human intervention.
Building a Scalable Observability Architecture
Constructing an enterprise-grade AI observability platform requires careful architectural planning to avoid creating performance bottlenecks or inflating cloud costs. Logging every prompt and high-dimensional vector embedding in real time can quickly generate terabytes of unstructured data daily.
To manage scale efficiently, organizations adopt a tier-based data pipeline strategy:
High-Throughput Ingestion Buffer: Utilizing distributed message queues like Apache Kafka or AWS Kinesis to handle incoming streaming telemetry without blocking primary application threads.
Real-Time Processing Engine: Applying stream processing frameworks such as Apache Flink to calculate rolling metrics, detect anomalies, and evaluate guardrail rules with sub-second latency.
Hybrid Storage Layer: Storing recent trace data and hot metrics in high-speed, indexed search databases for fast querying, while archiving historical log payloads into cost-effective object storage like Amazon S3 for long-term compliance and retraining.
Establishing clear data retention schedules and anonymizing sensitive payload fields ensures compliance with global data privacy regulations like GDPR and CCPA.
The Strategic Value of Comprehensive Observability
As companies expand their deployment of intelligent tools across operational workflows, technical debt often shifts from software codebases to model operations. Without robust observability, teams spend countless hours manually debugging stochastic outputs, attempting to reproduce intermittent failures, and managing unpredictable API billing spikes.
Implementing comprehensive, real-time observability provides engineering teams with the visibility needed to scale AI deployments confidently. By unifying infrastructure metrics, semantic trace records, and real-time evaluation guardrails into a single operational view, enterprises move beyond experimental pilots to deploy resilient, enterprise-ready systems that deliver consistent business value.