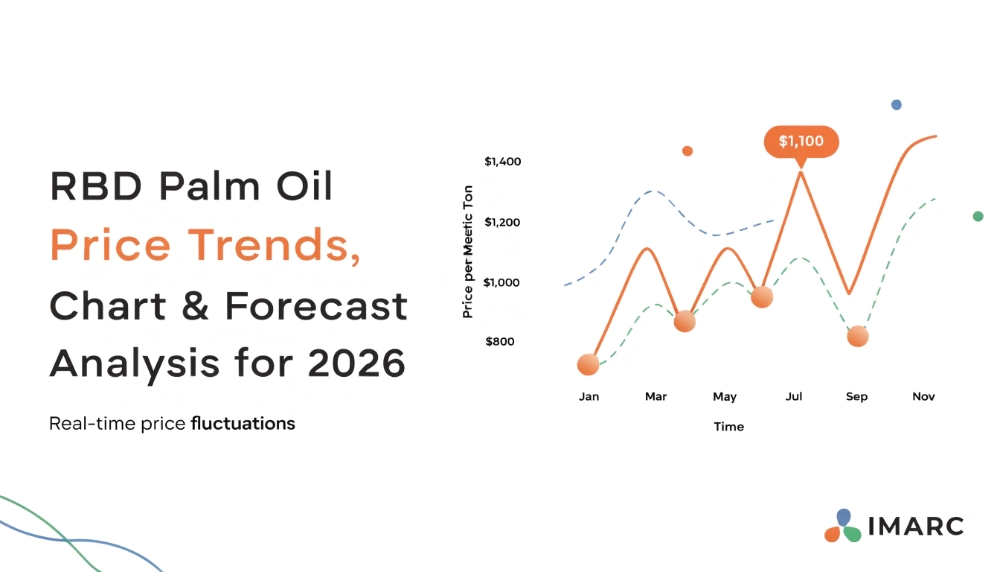
Global RBD Palm Oil Prices Outlook – Q3 2026
The RBD Palm Oil Price Trend reflects changes in global edible oil demand, production levels, export availability, and refining costs. According to IMARC Group's Q3 2026 price-tracking database and methodology, prices ranged from USD 1,174/MT in Indonesia to USD 1,924/MT in India. China recorded USD 1,281/MT, while Malaysia and the Netherlands reported USD 1,269/MT and USD 1,352/MT, respectively. These differences highlight regional variations in import requirements, supply conditions, and distribution expenses. Buyers can refer to the RBD Palm Oil Price Chart to monitor historical movements and support procurement planning. A confirmed quarterly percentage change requires comparable Q2 2026 data.
RBD Palm Oil Prices Q3 2026: Regional Price Snapshot
The reported prices across five major markets were:
Malaysia: USD 1,269/MT
Indonesia: USD 1,174/MT
China: USD 1,281/MT
India: USD 1,924/MT
Netherlands: USD 1,352/MT
India recorded the highest price at USD 1,924/MT, while Indonesia reported the lowest at USD 1,174/MT. China and Malaysia showed relatively close pricing, while the Netherlands remained between these markets and India. The spread reflects differences in import dependence, refining costs, local demand, and transportation expenses, making regional supplier comparisons important for procurement decisions.
Get A Sample Report Today - https://www.imarcgroup.com/rbd-palm-oil-pricing-report/requestsample
RBD Palm Oil Prices by Country: Regional Analysis
Asia-Pacific: Malaysia, Indonesia, China and India
Malaysia and Indonesia reported prices of USD 1,269/MT and USD 1,174/MT, respectively. Their established plantation and refining industries make production volumes, weather conditions, and export availability important pricing factors.
China recorded USD 1,281/MT, supported by its substantial edible oil consumption and import requirements. India reported USD 1,924/MT, reflecting a different procurement and distribution cost structure. Domestic demand, import expenses, port handling, and refining costs influence purchasing conditions.
Europe: Netherlands
The Netherlands recorded USD 1,352/MT. Its role as a European trading and distribution hub makes import availability, storage, refining, and transportation important factors affecting regional supply costs.
RBD Palm Oil Supply and Demand Overview – Q3 2026
Global supply depends on crude palm oil production, plantation yields, refining capacity, and export availability. Malaysia and Indonesia remain important suppliers to international markets.
Demand is driven by food processing, packaged foods, bakery products, confectionery, and frying applications. India and China are significant consumption markets, where import requirements influence purchasing activity. Production conditions, inventories, and competing vegetable oils also affect market availability.
RBD Palm Oil Price Trend & Historical Analysis
The RBD Palm Oil Price Trend helps businesses assess historical purchasing costs and regional market differences. During Q3 2026, the reported prices showed considerable variation between producing and importing markets.
The RBD Palm Oil Price Index supports comparisons across reporting periods, helping manufacturers, importers, and distributors evaluate procurement exposure. A reliable RBD Palm Oil price history chart should use consistent product specifications and comparable quarterly observations. Q2 2026 data is required to calculate the actual quarter-on-quarter movement.
RBD Palm Oil Price Forecast 2026: Next 12 Months
Over the next 12 months, prices will depend on plantation output, weather conditions, export policies, and international edible oil demand. Changes in Malaysian and Indonesian production could influence global availability.
Demand from India and China, alongside competition from soybean and sunflower oils, will remain important market indicators. Buyers should monitor inventories, freight expenses, and supplier quotations to manage procurement costs and plan purchasing agreements.
Key Factors Affecting RBD Palm Oil Prices
The major factors influencing prices include:
Weather conditions: Rainfall and drought affect plantation productivity and crop yields.
Production levels: Harvest volumes in Malaysia and Indonesia influence global supply.
Export policies: Duties and trade restrictions affect international availability.
Edible oil demand: Food manufacturing and household consumption influence purchasing requirements.
Competing oils: Soybean and sunflower oil prices affect substitution decisions.
Freight expenses: Shipping costs and port congestion influence delivered prices.
Refining costs: Energy, processing, and storage expenses affect final product costs.
What Is RBD Palm Oil and Where Is It Used?
Refined, Bleached, and Deodorized (RBD) palm oil is produced by processing crude palm oil to remove impurities, unwanted colour, and odour. It is widely used in packaged foods, bakery products, confectionery, instant noodles, frying applications, margarine, and shortening.
Its functional properties, availability, and versatility make it an important ingredient for food manufacturers.
RBD Palm Oil Industry Developments: Q3 2026 Highlights
Regional pricing differences remained significant during Q3 2026, with India recording the highest reported price and Indonesia the lowest. Malaysia and Indonesia remained important reference markets because of their role in international palm oil supply.
Production volumes, export availability, refining capacity, and shipping conditions remain important developments to monitor. Specific capacity expansions and supplier announcements should be included only when supported by verified industry disclosures.
Frequently Asked Questions About RBD Palm Oil Prices
What Were RBD Palm Oil Prices in Q3 2026?
Prices ranged from USD 1,174/MT in Indonesia to USD 1,924/MT in India. Malaysia recorded USD 1,269/MT, China USD 1,281/MT, and the Netherlands USD 1,352/MT.
What Does the RBD Palm Oil Price Trend Indicate?
The RBD Palm Oil Price Trend reflects changes in production, export availability, edible oil demand, and regional procurement costs. Monitoring these factors helps buyers evaluate supplier competitiveness.
Where Can I Find an RBD Palm Oil Price Chart?
An RBD Palm Oil Price Chart helps businesses compare historical prices, regional differences, and quarterly movements. IMARC Group provides commodity pricing intelligence to support procurement planning.
How IMARC Group Helps Businesses Track RBD Palm Oil Prices
IMARC Group provides regional pricing intelligence for manufacturers, importers, and procurement professionals. Its Q3 2026 data highlights significant differences across major markets. Monitoring production, export policies, edible oil demand, and freight costs helps businesses assess purchasing risks. Over the next 12 months, plantation output and international trade conditions will remain key pricing indicators.
Contact Us:
IMARC Group
134 N 4th St., Brooklyn, NY 11249, USA
Email: sales[@]imarcgroup.com
Tel No:(D) +91 120 433 0800
United States: +1-201971-6302